







Movie Information
Domestic Total: 26.71M
Opening Weekend: 5.53M
Legs: 4.11
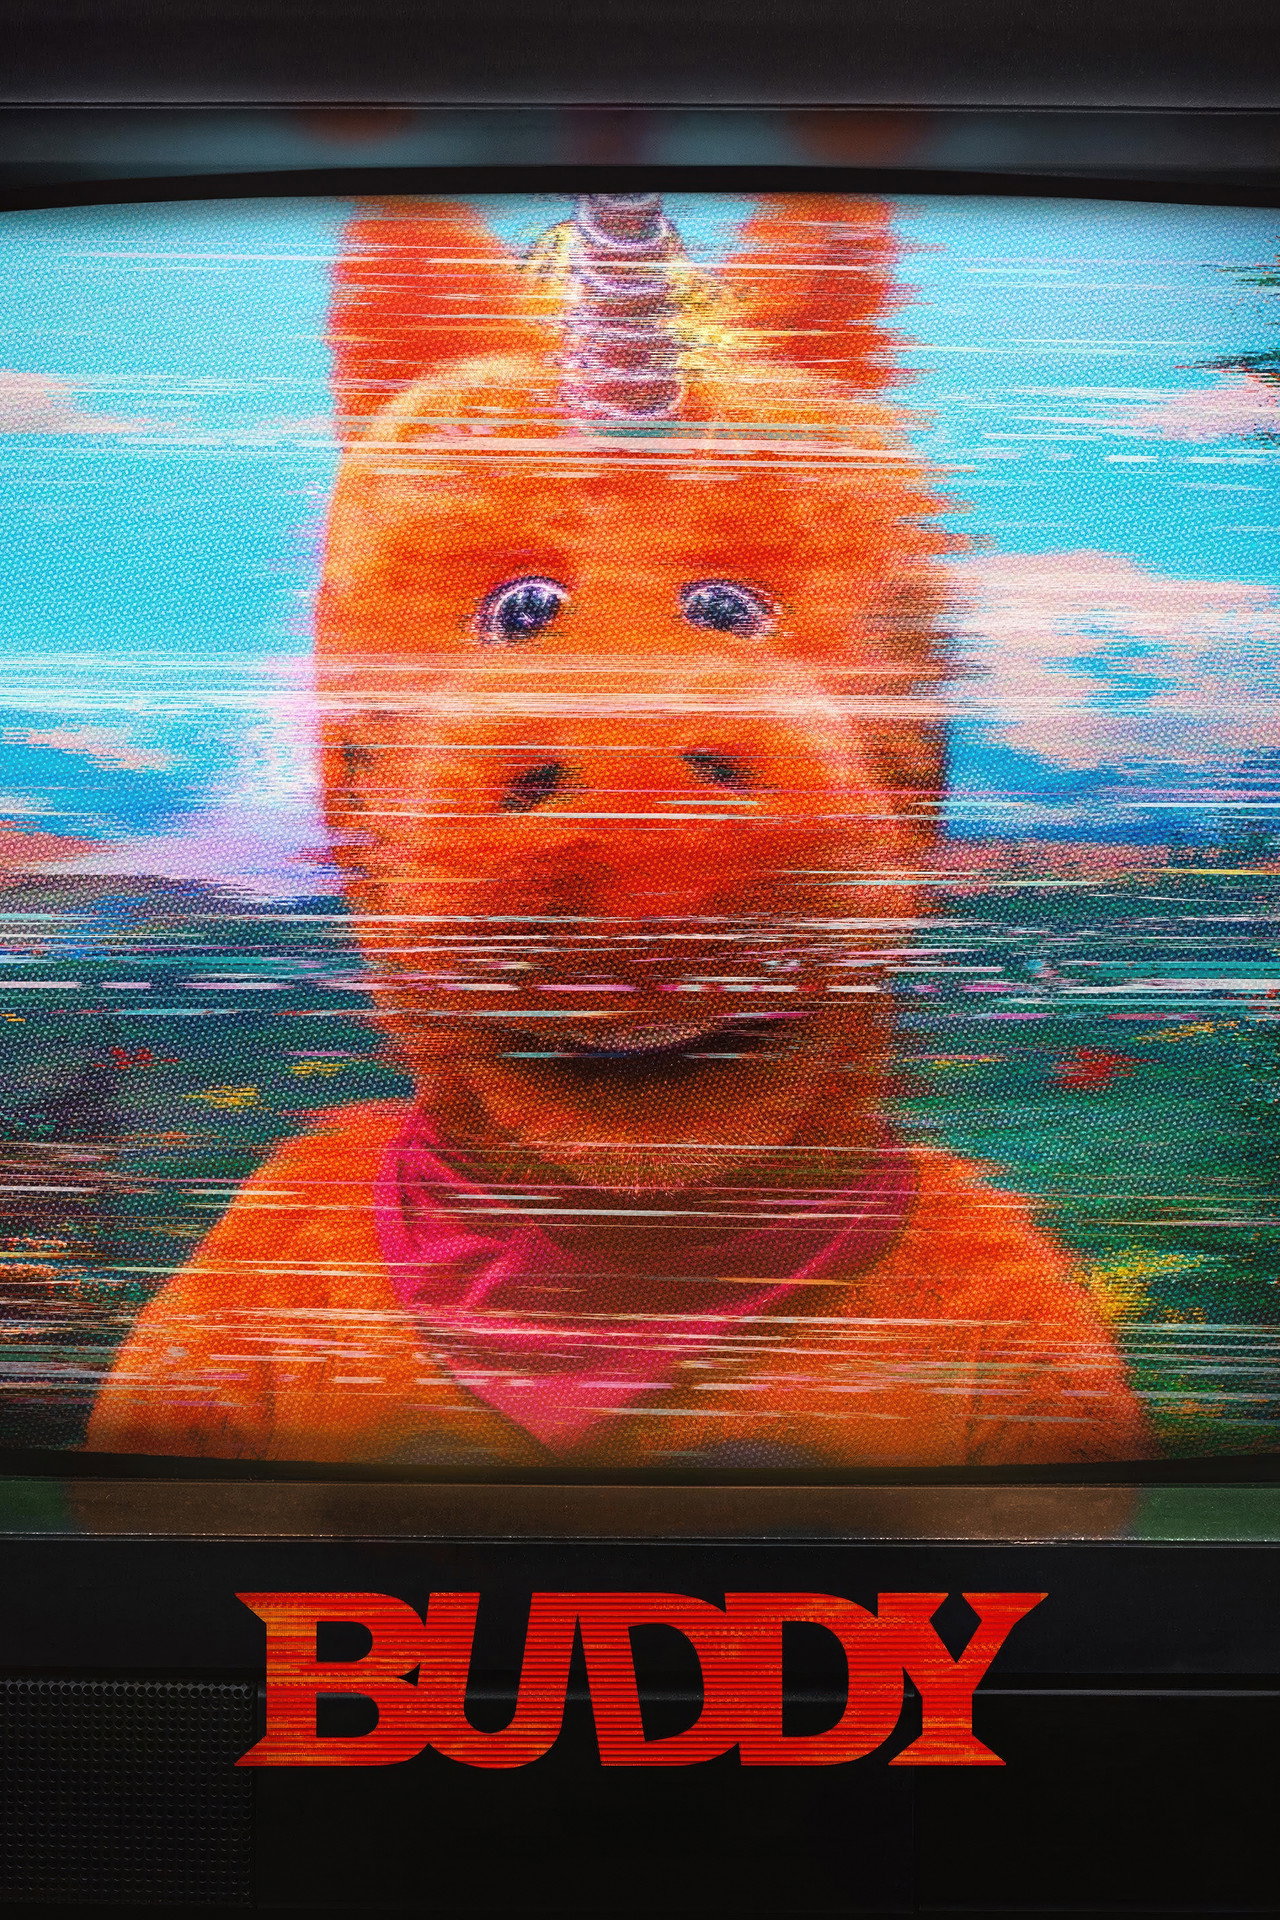
Overview: Remember BUDDY—the bright orange unicorn and star of that classic childrens' television show who brought joy and life lessons into your living room? Inside the colorful world of "It's Buddy!", a group of children spend their days singing, dancing, and helping Buddy spread happiness. But when one child refuses to play along, Buddy is not pleased and cracks begin to appear in this seemingly perfect world.
TMDB
IMDB
Metacritic
RT Tomato
RT Popcorn
Daily Table
| Date | Revenue | % YD | Theaters |
|---|---|---|---|
| Fri, Aug 28, 2026 | $2,215,918 | + 0.00% | 1277 |
| Sat, Aug 29, 2026 | $1,808,190 | -18.40% | 1277 |
| Sun, Aug 30, 2026 | $1,506,916 | -16.66% | 1277 |
| Mon, Aug 31, 2026 | $707,049 | -53.08% | 1277 |
| Tue, Sep 1, 2026 | $927,249 | + 31.14% | 1277 |
| Wed, Sep 2, 2026 | $705,237 | -23.94% | 1277 |
| Thu, Sep 3, 2026 | $713,169 | + 1.12% | 1277 |
| Fri, Sep 4, 2026 | $1,520,366 | + 113.18% | 1771 |
| Sat, Sep 5, 2026 | $2,083,082 | + 37.01% | 1771 |
| Sun, Sep 6, 2026 | $2,199,205 | + 5.57% | 1771 |
| Mon, Sep 7, 2026 | $1,605,282 | -27.01% | 1771 |
| Tue, Sep 8, 2026 | $809,728 | -49.56% | 1771 |
| Wed, Sep 9, 2026 | $563,699 | -30.38% | 1771 |
| Thu, Sep 10, 2026 | $468,312 | -16.92% | 1771 |
| Fri, Sep 11, 2026 | $1,045,846 | + 123.32% | 1720 |
| Sat, Sep 12, 2026 | $1,543,197 | + 47.55% | 1720 |
| Sun, Sep 13, 2026 | $1,030,379 | -33.23% | 1720 |
| Mon, Sep 14, 2026 | $362,535 | -64.82% | 1720 |
| Tue, Sep 15, 2026 | $515,994 | + 42.33% | 1720 |
| Wed, Sep 16, 2026 | $388,250 | -24.76% | 1720 |
| Thu, Sep 17, 2026 | $250,515 | -35.48% | 1720 |
| Fri, Sep 18, 2026 | $564,687 | + 125.41% | 1543 |
| Sat, Sep 19, 2026 | $823,981 | + 45.92% | 1543 |
| Sun, Sep 20, 2026 | $562,779 | -31.70% | 1543 |
| Mon, Sep 21, 2026 | $224,221 | -60.16% | 1543 |
| Tue, Sep 22, 2026 | $275,785 | + 23.00% | 1543 |
| Wed, Sep 23, 2026 | $202,814 | -26.46% | 1543 |
| Thu, Sep 24, 2026 | $104,273 | -48.59% | 1543 |
| Fri, Sep 25, 2026 | $207,346 | + 98.85% | 722 |
| Sat, Sep 26, 2026 | $307,245 | + 48.18% | 722 |
| Sun, Sep 27, 2026 | $182,820 | -40.50% | 722 |
| Mon, Sep 28, 2026 | $68,720 | -62.41% | 722 |
| Tue, Sep 29, 2026 | $90,040 | + 31.02% | 722 |
| Wed, Sep 30, 2026 | $76,828 | -14.67% | 722 |
| Thu, Oct 1, 2026 | $43,920 | -42.83% | 722 |
Cast
| Name | Character |
|---|---|
| Keegan-Michael Key | Buddy the Unicorn (voice) |
| Cristin Milioti | Grace |
| Delaney Quinn | Freddy |
| Caleb Williams | Wade |
| Madison Polan | Hannah |
| Tristan Borders | Oliver |
| Patton Oswalt | Strappy (voice) |
| Jimmica Collins | Betty Bunny (voice) |
| Eric Bauza | Mr. Mailbox / Worry Well / Couchy / Trashy / Pee Flower (voice) |
| Topher Grace | Ben |
| Bryson JonSteele | Derek |
| Seamus Flynn | Timothy |
| Luke Speakman | Josh |
| Bennie Taylor | Mailman Miles |
| Phuong Kubacki | Nurse Nancy |
| Devon Hawkes Ludlow | Charlie the Train (voice) |
| Michael Shannon | Willie (voice) |
| Clint Howard | George |
| Sergey Zhuravsky | Buddy the Unicorn (suit) |
| Jonathan Yurco | Dark Buddy (suit) |
| Cedwan Hook | Betty Bunny (suit) |
| Mark Aaron Buerkle | Therapist (Day Player) |
| Conner Stumm | Mailman Justin |
| Eric Salazar | Grilling Man |
| Lynette Eklund | Puppeteer |
| Tory J. Malone | Tyler |
| Brooke Bloom | Dr. Deborah Burr |
| Rachel Appelbaum | Clocky / Mr. Mailbox (uncredited) |
| Frank Brown Jr. | Father (uncredited) |
Comps
Comps are similar or comparison movies that are used for analysis and marketing purposes. The way they are found is described in more detail in the paper. Comps always have release dates before the movie they are compared to.
| Title | Release Date | Budget |
|---|---|---|
| Werewolves | Dec 4, 2024 | $0 |
| The Devil Conspiracy | Jan 13, 2023 | $0 |
| Freaky | Nov 12, 2020 | $5M |
| Saw X | Sep 27, 2023 | $13M |
| Annabelle: Creation | Aug 3, 2017 | $15M |
| Crimes of the Future | May 25, 2022 | $27M |
| Lee Cronin's The Mummy | Apr 15, 2026 | $22M |
| Barbarian | Sep 8, 2022 | $5M |
Profitability Breakdown
Domestic
Week 1: $8.58M
Week 2: $9.25M
Investor Share: $5.09M
Week 3+: $8.87M
Investor Share: $4.44M
International
$N/A (0.00%)
Investor Share: $N/A
Costs
Budget: $3M
P&A: $3M
Breakdown
Gross: $26.71M
Net: $14.67M
Costs: $6M
Profit
Profit: $8.67M
The profitability breakdown is based on Dan Murrell's YouTube videos (Dan Murrell is not affiliated with Reel Numbers). The breakdown only includes the theatrical release and does not account for any post-theatrical revenue streams such as streaming, home video, or merchandise sales. Additionally, the breakdown does not include any tax incentives, sponsorships, or product placement that may have occurred during production.