


Movie Information
Domestic Total: 56.95K
Opening Weekend: 5.95K
Legs: 4.55
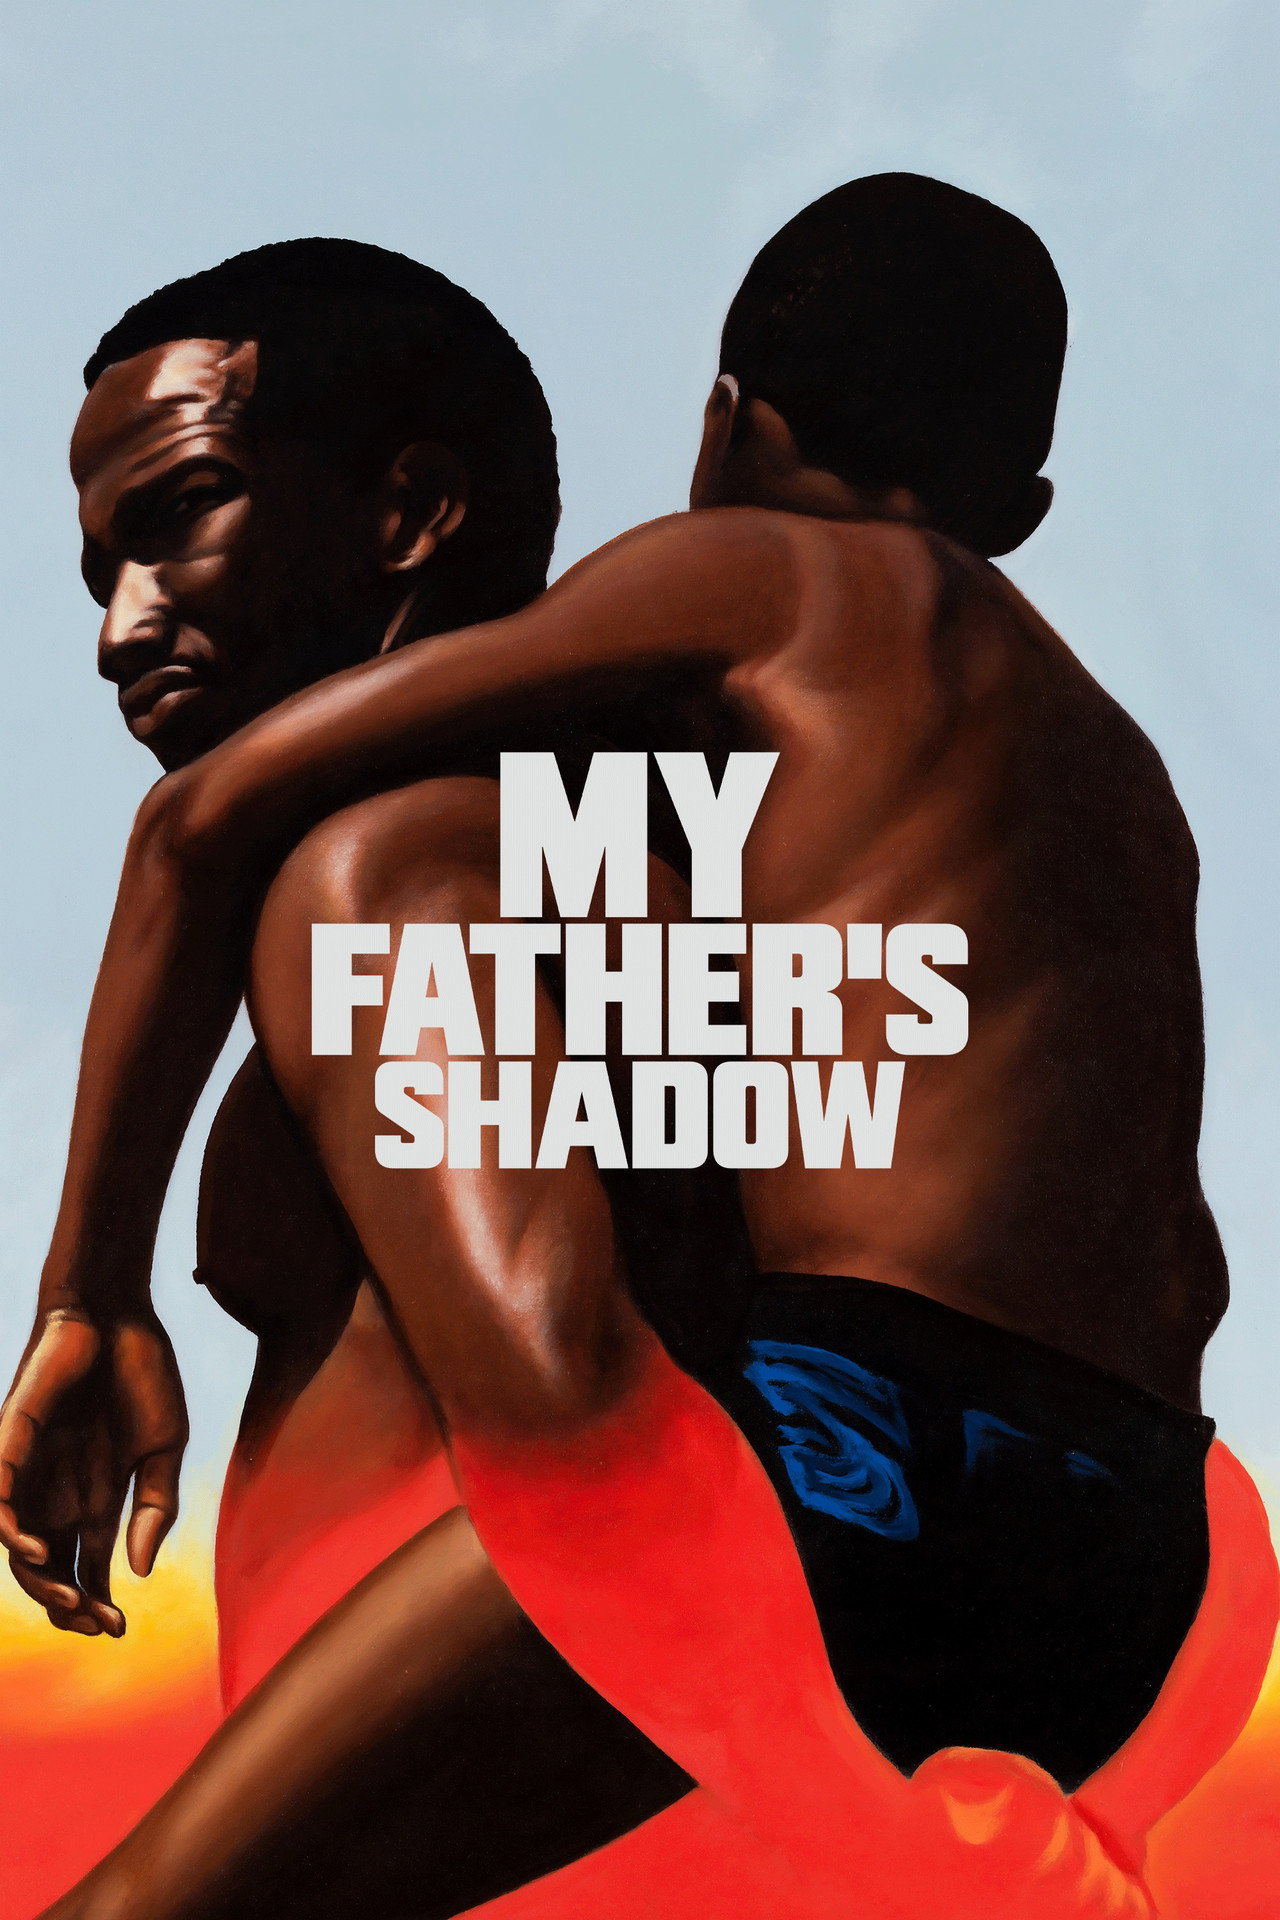
Overview: Two young brothers explore Lagos with their estranged father during the 1993 Nigerian election crisis, witnessing both the city's magnitude and their father's daily struggles as political unrest threatens their journey home.
TMDB
IMDB
Metacritic
RT Tomato
Daily Table
Cast
| Name | Character |
|---|---|
| Sope Dirisu | Folarin |
| Efon Wini | Bola |
| Godwin Egbo | Akinola |
| Chibuike Marvellous Egbo | Olaremi |
| Tosin Adeyemi | Aunty Seyi |
| Adesina McCoy Babalola | Gbemi |
| Lawrence Chu | Segun |
| Patrick Diabuah | Felix |
| Paul Edobor | Patron |
| Martha Ehinome Orhiere | Ngozi |
| Ayo Lijadu | Baba |
| Greg 'Teddybear' Ojeufa | Emeka |
| Uzoamaka Power | Abike |
Comps
Comps are similar or comparison movies that are used for analysis and marketing purposes. The way they are found is described in more detail in the paper. Comps always have release dates before the movie they are compared to.
| Title | Release Date | Budget |
|---|---|---|
| All Dirt Roads Taste of Salt | Nov 3, 2023 | $0 |
| Corsage | Jul 7, 2022 | $8M |
| The Carpenter | Nov 1, 2024 | $0 |
| 1982 | Oct 1, 2020 | $0 |
| Grand Tour | Nov 27, 2024 | $0 |
| On Becoming a Guinea Fowl | Dec 6, 2024 | $0 |
| Yardie | Aug 31, 2018 | $0 |
| Ali & Ava | Mar 2, 2022 | $0 |
Profitability Breakdown
Domestic
Week 1: $12.61K
Week 2: $10.38K
Investor Share: $5.71K
Week 3+: $33.96K
Investor Share: $16.98K
International
$754.3K (92.98%)
Investor Share: $264K
Costs
Budget: $N/A
P&A: $N/A
Breakdown
Gross: $811.24K
Net: $294.26K
Costs: $0.00
Profit
Profit: $294.26K
The profitability breakdown is based on Dan Murrell's YouTube videos (Dan Murrell is not affiliated with Reel Numbers). The breakdown only includes the theatrical release and does not account for any post-theatrical revenue streams such as streaming, home video, or merchandise sales. Additionally, the breakdown does not include any tax incentives, sponsorships, or product placement that may have occurred during production.